ML Lifecycle and Deployment
Data drift - data distribution changes i.e some changes in the actual data from the data that was used to train (ex: lighting variation)
Concept drift - mapping X → Y changes (ex: inflation of house prices)
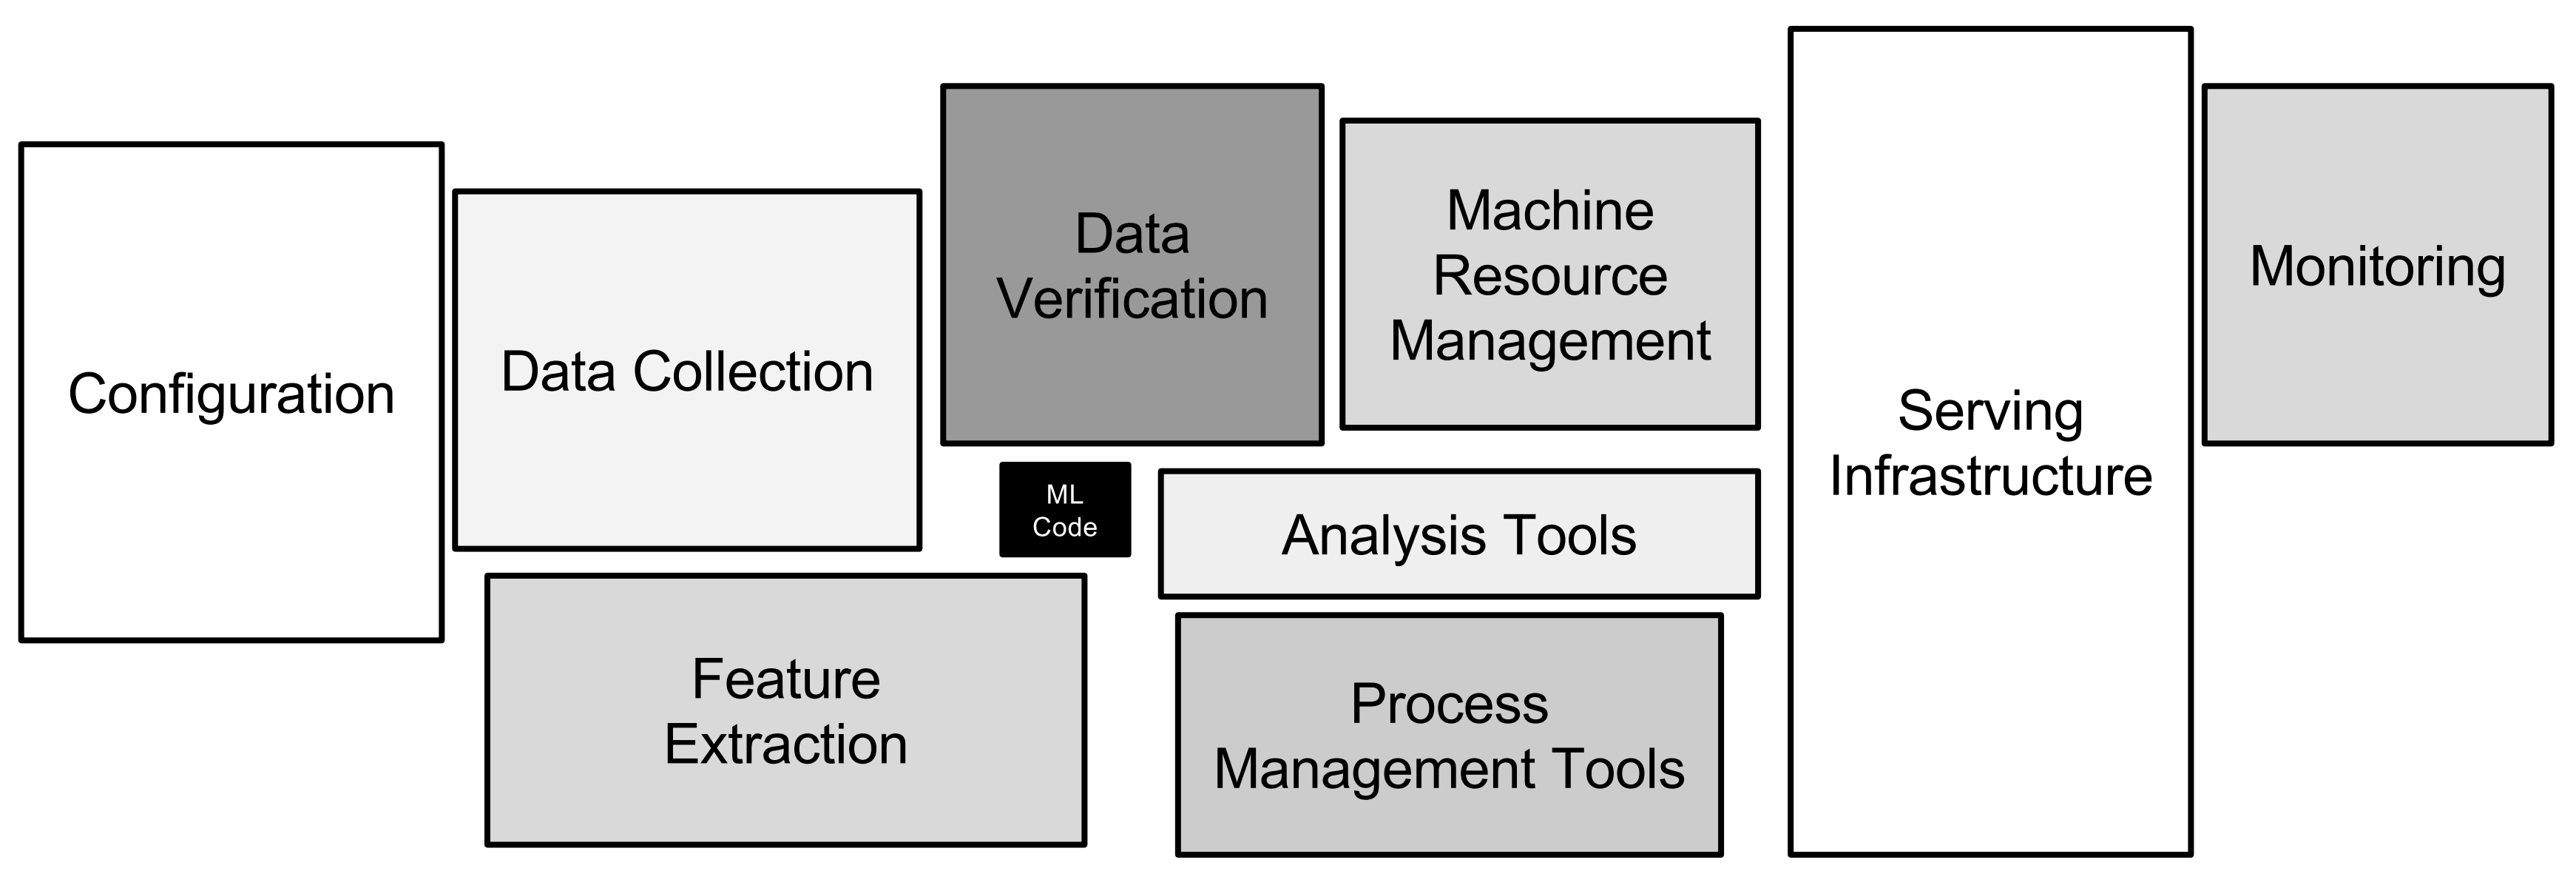
POC to Production Gap - ML model code ~ 5-10%, rest is ML project code (ex: data collection, feature extraction etc.)
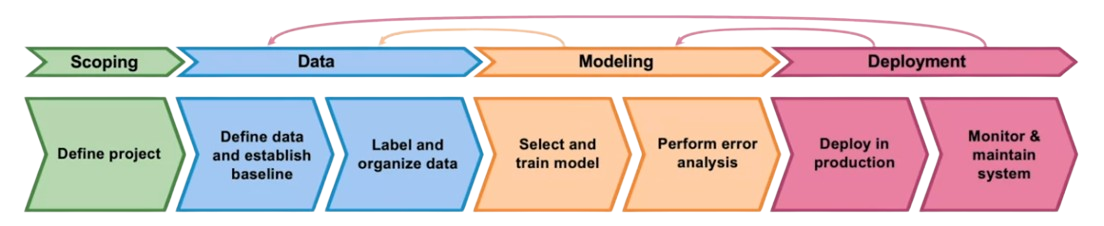
ML Project Life Cycle
Deployment
2 Key Challenges in Deployment:
- Concept/Data drift - Recognizing if/how (shock/gradual) the data changes and updating the model.
- Software engineering issues:
- Realtime or Batch ?
- Cloud vs Edge/Browser
- Compute ressources (CPU/GPU/Memory)
- Latency
- Logging
First deployment doesn’t mean you’re almost done, it means you’re 50% done.
Deployment patterns:
- Shadow mode - ML algorithm runs in parallel of human, but not used for decision. Useful to gather data about how the algorithm performs and how it compares to human judgement (or older ML implementation).
- Canary deployment - Roll out to a small fraction (~5%) of traffic. Allows to monitor system and ramp up traffic gradually.
- Blue Green deployment - Router switches traffic from blue version (old ML system) to green version (new ML system). Enables rollback.
Degrees of automation:
- Human only
- Shadow mode
- AI Assistance - ML system helps a human make decision (ex: highlights part of the image).
- Partial automation - Human intervention when ML system not confident.
- Full automation
Full automation isn’t necessarily the end goal, for many applications the best design point may be a human in the loop deployment.
Monitoring
Use a dashboard to monitor how the system is doing over time.
- Brainstorm the things that could go wrong.
- Brainstorm a few statistics/metrics that will detect the problem.
- It is ok to use metrics initially and gradually remove the ones you find not useful.
Example of metrics:
Software metrics - Memory, compute, latency, throughput, server load.
Input metrics - Avg input length, avg input volume, Num missing values, avg image brightness
Output metrics - # times return "" (null), # times user redoes search, # times user switches to typing, CTR.
Just as ML modeling is iterative (ML model → Experiment → Error analysis → ML model etc.), so is deployment (Deployment/Monitoring → Traffic → Performance analysis → Deployment etc.) to chose the right set of metrics to monitor.
Common practices:
- Set thresholds for alarms.
- Adapt metrics and thresholds over time.
In machine learning pipelines, cascading effects can be complex to track.
📁 Ressources
📖 Concept and Data Drift
📖 Monitoring ML Models
📽️ A Chat with Andrew on MLOps: From Model-centric to Data-centric
📜 Towards ML Engineering: A brief history of TensorFlow Extended (TFX)
📜 Challenges in deploying machine learning: A survey of case studies.
📜 Hidden technical debt in machine learning systems.
Modeling Challenges and Strategies
Select and train a model
3 key milestones:
- Doing well on training set (usually measured by avg training error)
- Doing well on dev/test sets.
- Doing well on business metrics/project goals
MLE : “I did well on the test set!”
Product Owner : “But this doesn’t work for my application.”
MLE : “But… I did well on the test set!”
Info
For many problems, having a high test set accuracy is not sufficient for achieving the goals of the project.
Examples of why a good avg test error might not be enough:
- Insufficient performance on disproportionately important examples (navigational queries like YouTube, Reddit)
- Unacceptable level of bias or discrimination.
- Poor performance on rare classes.
Hint
When starting a machine learning project, one of the most useful first step is to establish a baseline.
Ways to establish a baseline:
- Human Level Performance (HLP)
- Literature search of state-of-the-art/open source
- Quick-and-dirty implementation
- Performance of older system
Baseline helps indicate what might be possible. In some cases (such as HLP) it also gives a sense of what is irreducible error/Bayes error.
Tips on starting a machine learning project
Getting started on modeling
- Literature search to see what’s possible
- Open-source implementation if available
- Reasonable algorithm with good data often > great algorithm with not so good data.
Deployment constraints?
- Yes if baseline already established and goal is to build and deploy.
- No if purpose is to establish a baseline and determine what is possible/worth pursuing.
Tip
Try to overfit a small training dataset (even only one example) before training on a large one.
Error analysis
Use tags/properties to analyze misclassified examples. During this process you may come up with ideas for additional tags/properties.
Examples
- 🔎 Visual inspection :
- Specific class labels (scratch, dent, etc.)
- Image properties (blurry, dark/light background, reflection…)
- Other meta-data: phone model, factory
- 👍 Product recommendation:
- User demographic
- Product features
Useful metrics for tags
- What fraction of errors has that tag ?
- Of all data with that tag, what fraction is misclassified ?
- What fraction of all the data has that tag ?
- How much room of improvement is there in that tag ?
Decide on most important categories to work on based on:
- How much room for improvement there is.
- How frequently that category appears.
- How easy it is to improve accuracy in that category.
- How important it is to improve in that category.
Speech recognition example 💬
Type Accuracy HLP Gap to HLP % of data Improvement Clean Speech 94% 95% 1% 60% 0.6% Car Noise 89% 93% 4% 4% 0.16% People Noise 87% 89% 2% 30% 0.6% Low Bandwith 70% 70% 0% 6% 0% Even if we initially thought that focusing on improving the Car Noise accuracy would be the best since it had the highest accuracy gap (4%), it turns out that since it makes for so few of the data, other categories are source of greater improvement.
One fruitful way of improving the performance of a certain category is to add/improve the data.
- Collect more data.
- Use data augmentation to get more data.
- Improve label accuracy/data quality.
By carrying out an analysis like this, you can be much more focused in exactly what types of data you collect, without wasting time trying to collect more data from a less interesting category.
Skewed Datasets
With datasets where there is a heavy imbalance between classes, it’s important to using a suiting metric to evaluate the model.
Interesting metrics to analyse for skewed datasets : Precision, Recall, F1-Score.
Performance auditing
Even if your algorithm is doing well, it’s often worth one last performance audit before you push it to production. This can sometimes save you from significant post deployment problems.
- Brainstorm the ways the system might go wrong
- Performance on subsets of data (e.g., ethnicity, gender)
- Prevalence of specific errors/outputs (e.g., FP, FN)
- Performance on rare classes
- Establish metrics to assess performance against these issues on appropriate slices of data.
- Get business/product owner buy-in.
Data Augmentation
Goal : Create realistic examples (i) that the algorithm does poorly on (ii), but humans (or other baseline) do well on (iii).
- Does it sound realistic?
- Is the X→Y mapping clear ? (e.g, can humans recognize speech?)
- Is the algorithm currently doing poorly on it ?
Adding features
For structured data (e.g, databases), creating new training examples is difficult. Another way to improve your model performance is to add relevant features to the existing training examples. These features can be found through error analysis, user feedback and benchmarking to competitors.
Experiment tracking
As you’re working to iteratively improve your algorithm, one thing that’ll help you be a bit more efficient is to make sure that you have robust experiment tracking.
- What to track : Algorithm/code versioning - Dataset used - Hyperparameters - Results
- Tracking Tools : Text file - Spreadsheet - Experiment tracking systems (Weights&Biases, Comet, MLFlow, Sagemaker Studio, Landing.AI)
- Desirable features : Data to replicate results - Analysis of experiment results - Ressource monitoring, visualization, model error analysis
From Big Data to Good Data
Try to ensure consistently high-quality data in all phases of the ML project lifecycle.
- Cover of important cases (good coverage of inputs x)
- Defined consistently (definition of labels y is unambiguous)
- Has timely feedback from production data (distribution covers data drift and concept drift)
- Sized appropriately
📁 Ressources
🔧 LandingLens, a computer vision error analysis tool.
🔧 TensorFlow Model Analysis (TFMA)
📖 Establishing a baseline
📖 Error analysis
📖 Experiment tracking
📜 Toward trustworthy AI development: Mechanisms for supporting verifiable claims
📜 Deep double descent: Where bigger models and more data hurt.
Data Definition and Baseline
In machine learning, clear data definitions and consistent labeling are crucial because they directly impact the quality, reliability, and accuracy of a model. Here’s why they matter so much:
- Model Accuracy: Inconsistent labels or ambiguous definitions introduce noise, which can cause the model to learn incorrect patterns. For example, if one annotator labels a chest X-ray as “normal” and another labels a similar image as “abnormal,” the model may struggle to learn accurate decision boundaries.
- Data Quality and Reproducibility: Well-defined labels ensure that each instance in the dataset is representative of the underlying pattern. Consistent data definitions and labeling standards mean that another team could replicate results by following the same criteria, improving reliability.
- Bias Reduction: Ambiguous or inconsistent definitions may introduce bias, leading the model to make predictions based on misleading trends. Clear data definitions ensure each class or label is representative and balanced, promoting fairer outcomes.
- Cost Efficiency: Re-labeling or revisiting data to correct inconsistencies is time-consuming and costly. Consistency from the start reduces the need for repeated adjustments and leads to faster model deployment.
- User Trust: In applications like healthcare, where you have a specific interest, or autonomous driving, consistency in data labeling can build trust in the application by reducing the likelihood of critical errors that could impact users’ lives.
Improving Label Consistency
- Have multiple labelers label same example.
- When there is disagreement, have MLE, subject matter expert (SME) and/or labelers discuss definition of to reach agreement (ex: standardize labels, merge classes, create label to capture uncertainty).
- If labelers believe that doesn’t contain enough information, consider changing .
- Iterate until it is hard to significantly increase agreement.
Small data vs big data
Small data - Clean labels are critical.
Big data - Emphasis on data process (how you collect, install the data, labeling instructions). Much harder to go back and re-label.Big data problems can have small data challenges too (rare classes).
Human-level performance (HLP)
Estimate Bayes error / irreducible error to help with error analysis and prioritization.
Uses:
- In academia, establish and beat a respectable benchmark to support publication.
- Business or product owner asks for 99% accuracy. HLP helps establish a more reasonable target.
- “Prove” the ML system is superior to humans doing the job and thus the business or product owner should adopt it. (⚠️ Use with caution)
Ground Truth : External vs Human Label
When the ground truth label is externally defined, HLP gives an estimate for Bayes error/ irreducible error. But often, ground truth is just another human label.
- HLP << 100% may indicate ambiguous labeling instructions.
- Improving label consistency will raise HLP.
- This makes it harder for ML to beat HLP. But the more consistent labels will raise ML performance, which is ultimately likely to benefit the actual application performance.
How long should you spend obtaining data?
- Get into the iterative process (Model+Data+Hypp → Training → Error analaysis …) as quickly as possible.
- Instead of asking How long will it take to obtain examples, ask How much data can we obtain in days.
- Exception : if you have worked on the problem before and from experience know you need examples.
To make data collection effective, a step you should often do is brainstorm the list of data sources: source, amount, cost, time, quality, privacy, regulatory constraints. You might find out that purchasing data will save you a lot of time and get you in the iterative process quicker instead of labeling the data yourself.
Data Pipelines
POC (proof-of-concept):
- Goal is to decide if the application is workable and worth deploying.
- Focus on getting prototype to work
- Ok if data pre-processing is manual, but take extensive notes/comments.
Production phase: - After project utility is established, use more sophisticated tools to make sure the data pipeline is replicable, e.g, TensorFlow Transform, Apache Beam, Airflow…
Keep track of data provenance (where it comes from) and lineage (sequence of steps). Very useful for error analysis and spotting unexpected effects (ex: line 17 produces a lot of defects or null).
Data Split
A balanced data split (train/val/test) is very important when you have imbalanced labels. It will make a big difference in performance.
Scoping
Picking what project to work on.
- What project should we work on ?
- What are the metrics for success ?
- What are the resources (data, time, people) needed ?
Scoping Process
- Identify a business problem (not an AI problem), for example What are the top 3 things you wish were working better?
- Brainstorm AI solutions
- Assess feasibility & value of potential solutions
- Determine milestones
- Budget for resources
Feasibility
| Unstructured | Structured | |
|---|---|---|
| New | HLP | Predictive features available? |
| Existing | HLP History of project | New predictive features? History of project (rate of improvement) |
Diligence on value
- MLE metrics : Word-level accuracy
- Query-level accuracy
- Search result quality
- User engagement
- Business metrics : Revenue
Have technical and business team try to agree on metrics that both are comfortable with.
Ethical considerations
- Is this project creating net positive societal value ?
- Is this project reasonably fair and free from bias ?
- Have any ethical concerns been openly aired and debated ?
Milestones
- ML metrics (accuracy, precision/recall, etc.)
- Software metrics (latency, throughput, etc. given compute resources)
- Business metrics (revenue, etc.)
- Resources needed (data, personnel, help from other teams)
📁 Ressources
🔧 Data Pipelines : TensorFlow Transform, Apache Beam, Airflow
📖 Label ambiguity
📖 Data pipelines
📖 Data lineage
📖 MLops
📜 Comparing deep neural networks against humans: object recognition when the signal gets weaker.